
Web dashboard
The dashboard is one client of the server, like the TUI and the CLI. Everything below acts through the same API, so a change made here shows up in the other two without a refresh.
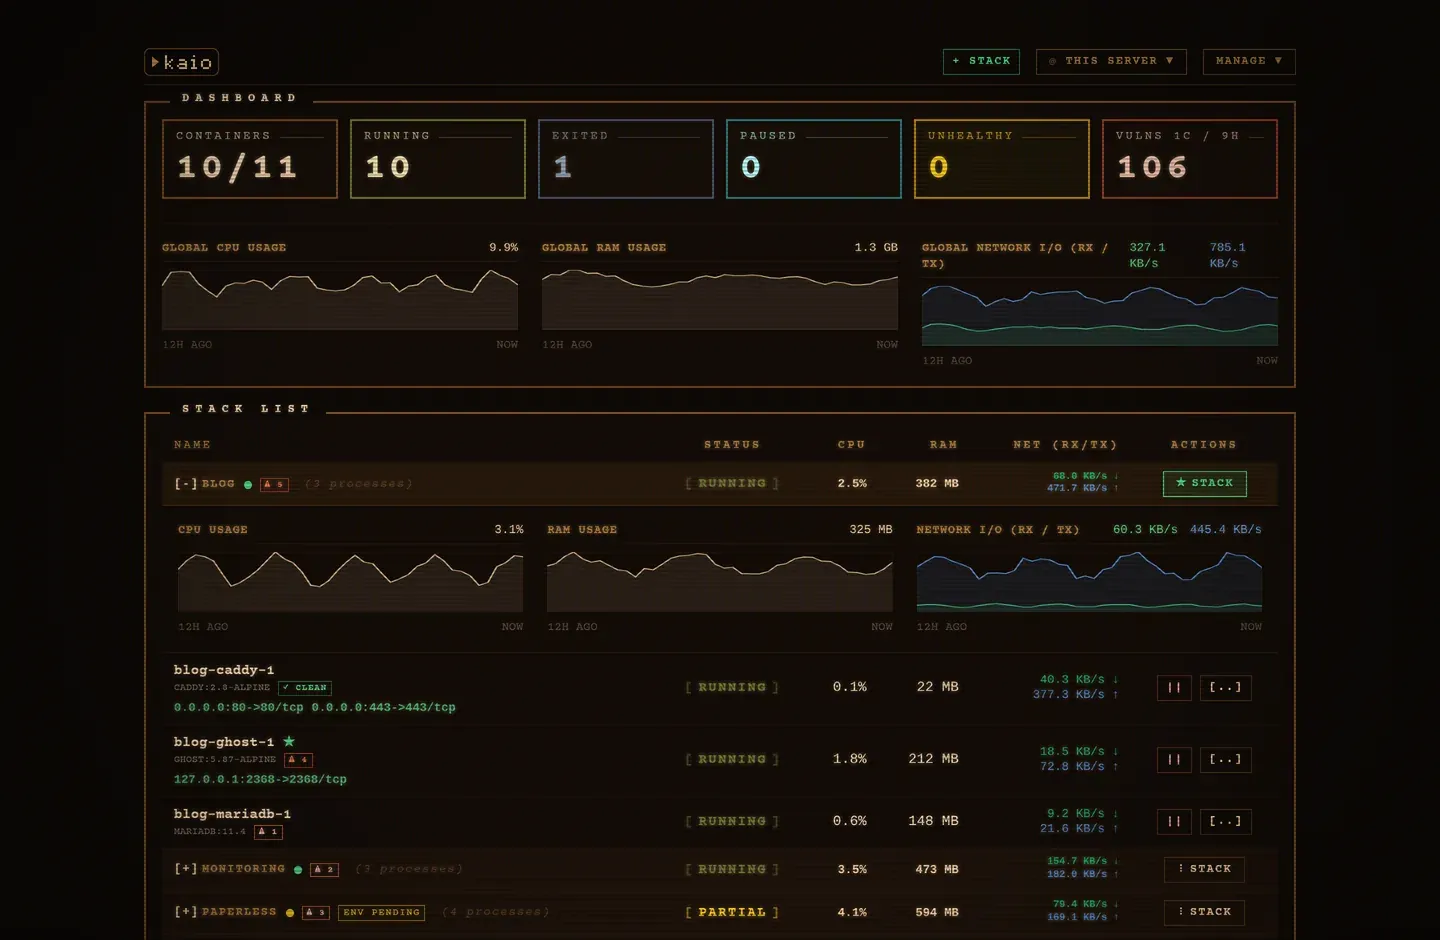
Top bar
Section titled “Top bar”| Control | What it does |
|---|---|
+ STACK |
Opens the deploy dialog: a name, the Compose file in the editor, and its variables |
@ <server> ▼ |
Which server the whole page drives. Absent until a node has joined |
MANAGE ▼ |
The management panels: Containers, Images, Networks, Volumes, Nodes, System |
The server selector
Section titled “The server selector”@ this server is the default. Picking a node re-points every panel of the page
at it, through the control plane’s gateway, so the tables, the logs and the
terminal all describe that machine. A node that is not online colours the
button red, and Manage nodes… at the bottom of the list opens the same panel
as Manage → Nodes.
The address bar follows, at /node/<name>, so the view of one server is a link
you can share or bookmark. The selection also survives a reload on its own: a
bare / reopens the last server you drove, and its path is restored in the
address bar.
Dashboard panel
Section titled “Dashboard panel”Six counters, then three charts over a 12-hour window:
| Tile | Counts |
|---|---|
| Containers | Running over total |
| Running, Exited, Paused | Containers in that state |
| Unhealthy | Containers whose healthcheck fails |
Vulns <n>C / <n>H |
Critical and high CVEs summed over in-use images |
The charts are Global CPU Usage, Global RAM Usage and Global Network I/O (RX / TX). Hovering one reads a single point rather than a tooltip average.
Stack list
Section titled “Stack list”One row per stack, with its containers underneath once expanded.
| Column | Holds |
|---|---|
NAME |
[+] / [-], the stack name, a status dot, its vulnerability badge, and ENV PENDING when variables are saved but not applied |
STATUS |
The aggregated state: RUNNING, PARTIAL, PAUSED or EXITED |
CPU, RAM, NET (RX/TX) |
Summed across the stack’s containers |
ACTIONS |
The stack menu |
A stack with no containers is listed all the same, as [NOT STARTED] with (0 processes). A copy that was written but not brought up would otherwise be invisible here while the CLI and the TUI both listed it.
Clicking anywhere on the row expands it. Containers that belong to no Compose project are grouped under Standalone Containers.
The stack menu
Section titled “The stack menu”The button reads ⋮ STACK, and turns green and pulses to ★ STACK when an
image update is waiting.
| Entry | Shown when | Documented in |
|---|---|---|
▶ Start |
Something in the stack is stopped or paused | Managing stacks |
⏸ Pause |
Something in the stack is running | Managing stacks |
⟲ Restart |
Always | Managing stacks |
✎ Edit |
Always. Opens the compose file and the variables together | Environment variables |
✓ Apply changes |
Variables are saved but not deployed | Environment variables |
≡ Versions |
Always. Preview a version, then roll back or delete it | Versions & rollback |
? Check Updates |
Always. Asks the registry, pulls nothing | Image updates |
↻ Update |
Always. Pulls and recreates | Image updates |
⧉ Copy to... |
Always. Pick a destination, a name, and whether the volume data comes along. The ports and the variables are editable in place, and a port already taken on the destination blocks the copy until it moves | The API route |
▤ Logs |
Always. Every container of the stack, merged by service | Logs & terminal |
⚠ Scan |
Always. Trivy over every image of the stack | Vulnerability scanning |
✕ Delete |
Always. Removes the containers and the stack directory | Managing stacks |
A menu that would open past the bottom of the window flips above its button and caps its own height, so no entry ends up unreachable.
Container rows
Section titled “Container rows”Each container carries its own [..] menu:
| Entry | Opens |
|---|---|
[L] Logs |
That container’s stream alone |
[S] Shell |
An interactive sh inside it |
Manage panels
Section titled “Manage panels”| Panel | What it offers |
|---|---|
| Containers | Every container, selectable. Start, Stop and Delete Selected act in bulk |
| Images | Every image, its vulnerability badges, Scan All, Prune, and a per-image report |
| Networks | List and delete |
| Volumes | List and delete |
| Nodes | The cluster registry: NAME, STATUS, URL, VERSION, SHA, LAST SEEN, plus + Add a server, Check All, and a per-node probe or removal |
| System | Prune Containers, Prune Images, Prune Networks, Prune Volumes, each reporting what it reclaimed |
System events
Section titled “System events”The panel under the stack list is the event history, newest first, with the
level of each entry. It is fed by the same SSE stream as the rest of the page,
so an event appears as it happens. Retention is set by
KAIO_EVENTS_RETENTION_DAYS; see Data retention.
Dialogs
Section titled “Dialogs”Every dialog closes on Escape, on a click outside it, or on Close [X].
Monaco and the terminal are loaded only when a dialog needs them, which is why
the first Edit or Shell of a session takes a moment longer.
Motion
Section titled “Motion”The interface follows the operating system’s prefers-reduced-motion setting:
with it on, the pulsing update indicator and the status dots stop animating.
Related
Section titled “Related”- TUI shortcuts, the same actions as single keys
- CLI, the same actions as commands
- HTTP API, what all three of them call
Kaio, built by Régis Gaidot